

Year End Portfolio Review
At the start of 2024, we were cautious about how stocks would perform for several reasons. Ongoing wars heightened geopolitical risks. Inflation fell from its high of 9% in 2022 but was still nearly twice the Fed’s target rate. The Treasury yield curve was still inverted, a near flawless historical indicator of recessions in the United States. Large-cap stocks were trading near historically high valuation levels, and the concentration of the S&P 500 was about as high as ever. Despite these risks, the S&P 500 once again posted significant gains, generating a total return of 25% for the year. US small-cap, international, and emerging market stocks were also positive for the year, but only managed single-digit returns. Bond returns were muted as rising long-term interest rates pushed bond prices down and liquid alternatives continued to deliver a mix of exceptional returns. All in all, it was not a bad year for investors.
LARGE-CAP STOCKS LEAD THE WAY
The S&P 500 continued to beat other areas of the market in 2024. The excess returns were once again driven by the Magnificent 7 stocks, as these companies contributed to over half of the index’s return for the year. All but one of these seven stocks outperformed the S&P 500 and most by a large margin. It would have been beneficial to be undiversified and invest entirely in these mega-cap companies, however, the risks associated with this strategy only escalated. As of year-end, the cyclicallyadjusted P/E (CAPE) ratio of the S&P 500 now hovers around 38x, up from 31x at the start of the year. Looking back over 100 years, there’s only one other time when valuations have been higher: during the height of the Dot-Com boom, when the index peaked at 44x.
Not only are valuations high, but concentration levels reached absurd levels for large-cap stocks. The ten largest stocks currently make up over 37% of the entire S&P 500 index, which is far above the 25% level during 2000.
There are other parallels between now and 2000, chief among them is that anyone not holding large- cap growth stocks looks foolish. But stock market returns in the wake of 2000 are instructive. Large- cap growth stocks lost more than 4% annualized over the course of a decadewhile large-cap value stocks were positive. Small-cap value stocks outperformed small-cap growthstocks by nearly 10% annualized, and small-cap stocks outperformed large-cap stocks. Emerging market stocks dominated
U.S. stocks by generating double-digit returns. Past performance is not indicative of futurereturns, so there is no telling if or when this period will follow suit. However, abandoning diversification now to jump on the Magnificent 7 bandwagon seems overly risky to us.
FED CUTS RATES, BUT LONGER-TERM RATES RESIST
Among other considerations, including the recent decline in inflation data, the Fed decided it was time to reduce the Federal Funds rate. In September, the Federal Funds rate was 5.25% – 5.50%. By the end of the year, the interest rate range was reduced by a full point to 4.25% – 4.50%. While this reduction caused the shorter end of the yield curve to fall, longer-term interestrates actually went up. The ten- year Treasury yield rose from 3.9% at the start of the year to 4.6%. Thissteepening of the yield curve was beneficial to those holding shorter-duration bonds. Not only did short bonds have a higher starting yield to begin the year, but they avoided the negative price impactthat rising rates had on longer- duration bonds. The Bloomberg Aggregate Bond Index was impactednegatively by the increase in longer-term bond yields, as it only returned 1.3%. In comparison, cash had a return of 5.5% as measured by the yield on the 3-month T-bill.
So why did longer-term rates rise despite a reduction in short-term rates? Inflation expectations are likely a strong factor. While inflation did fall slightly from the beginning of the year, it is still a bit above the Fed’s 2% target. It also began to creep back up in recent months. In December, the Federal Open Market Committee (FOMC) revised its expectation for inflation by the end of 2025 to 2.5% vs its expectation of 2.1% in its projections just three months prior. It also predicted two fewer rate cuts than previously expected in 2025, in case inflation is stickier than previously anticipated.
Expected policy changes from the new administration may play a factor in this, as an increase in tariff rates would likely lead to higher prices for some products. Reducing tax rates, while stimulative to the economy, may also be inflationary. If spending cuts and revenue from tariffs are less than the revenue lost from lower tax rates, the deficit will widen. This will likely cause debt-to-GDP levels to continue to grow, which is another factor weighing on longer-term interest rates.
ANOTHER STRONG YEAR FOR ALTERNATIVES
Alternative investments once again posted notable returns for the year. The style premia strategy led the way with an impressive 21% return. Catastrophe bonds were also solid with double-digit returns. All other liquid and semi-liquid strategies (managed futures, multi-strategy, andalternative lending) had smaller returns but were all positive and all outperformed the aggregate bond index.
Over the past five years, these strategies all performed well, averaging an annualized return in the high single-digits. All have been much better than the aggregate bond index, which has had a negative return over the same period. Shifting a portion of a traditional bond portfolio into these funds has been beneficial in generating higher returns and offering downside protection. This was apparent in 2022 when stocks and bonds both fell, and alternatives held strong. As previously mentioned, there’s no way to predict if this will continue, but long-term data shows that substituting a portion of bonds for these non-traditional assets has been successful in generating higher returns and providing additional sources of diversification to an overall portfolio.
LOOKING AHEAD
There is still much to be concerned with in 2025. It’s possible that mega-cap stocks will continue to leave all other companies in the dust, which the market seems to be predicting. However, it seems unlikely to us that they can defy gravity forever. When will the music stop? Unfortunately, there is no way to know. Predicting what will happen in the short term is futile. It may take an economic shock, a policy mistake, continued inflation, or some other catalyst for markets to revert. Aswe mentioned countless times, our portfolios are constructed in a way that has historically outperformed during market downturns by taking factor exposures, using safer short-durationbonds, and various alternative strategies. We hope for the best but are prepared for the worst.
A Tale of Two Economies
Now that the presidential election is in the rearview mirror, there is much speculation on what lies ahead for the economy and the stock markets. It is impossible not to let personal politics color your view on this topic, but whichever way you lean, it seems all but certain that the next four years will be defined by disruption.
That disruption could go in a couple of different directions. It could be what economist Joseph Schumpeter called creative destruction. The “you’ve got to break a few eggs to make an omelet”type of disruption that turns out wildly positive in the end. However, there is also a risk that we will have disruption, which is more of the Trumpian chaos we saw in his first administration.
One path could lead to a rebirth of economic growth, while the other could face a long period of stagnation.
THE ‘RENAISSANCE’ SCENARIO
The optimistic view of our coming environment could include an economic renaissance where GDP grows close to 3%, interest rates fall, inflation is finally tamed, and businesses are left alone to drive productivity. Some specific proposals include:
- Cutting corporate income tax rates to 15% and rolling back government
- Making prior tax cuts permanent and extending tax reductions on certain types of income for
- Creating the “DOGE” (Department of Government Efficiency) to identify areas of government waste and reduce spending.
LOWERING CORPORATE TAX RATES
If corporate tax rates fall, intuitively, that’s a good thing for corporate profitability. In June
2023, Michael Smolyansky, a Principal Economist of the Federal Reserve, published a study called ‘End of an Era.’ It showed how corporate profits enjoyed a massive tailwind from declining corporate tax rates and declining interest rates for three or four decades.
This study looks at two different time periods: 1962 to 1989, back when tax rates were higher, and 1989to 2019 when corporate tax rates were falling. If you compare these two periods, the economy grewfaster in that earlier period, as the large Baby Boom generation came of age. Corporate sales growth was also higher in the earlier period, reflecting the faster economic growth. However, earnings growth was almost twice as strong in the latter period because the frictions of corporate taxes and interest expense were significantly reduced.
This had a profound impact on the stock market, as the equity risk premium, which is nerdy academic speak for returns in excess of Treasury bonds, was twice as high during the latter period at 7.2% versus 3.6%. Removing obstacles to profitability can be a catalyst for a rising tide that lifts all ships.
INDIVIDUAL TAX CUTS
Trump is also talking about eliminating taxes on Social Security, tip income, and overtime wages. While these should all be stimulative to the economy, we don’t view them all as good policies. One could make the argument that not taxing Social Security makes sense. After all, why does the government give out money and then collect taxes on it? It would be more efficient to just give less money, to begin with. However, favoring certain sources of income from the privatesector, like tips and overtime wages, doesn’t make sense to us. Why should the server pay less taxesthan someone washing dishes in the kitchen? Nevertheless, more money in the hands of consumers could lead to stronger economic growth.
M&A ACTIVITY
The potential for an increase in merger & acquisition deals could also contribute to economic efficiency and further stock market gains. Since the post-Covid pop in activity, both the number and value of deals have declined markedly, to the point that we are back to Obama-era levels.
Trump has promised to remove current Federal Trade Commission Chair Lina Khan, who has been a barrier to closing deals during the Biden administration. When that hurdle goes away, there should be more activity, which could be good for stock market valuations. That is particularly true for smaller-cap stocks because competition among larger potential buyers can help boost their stock prices.
That’s the good news.
THE ‘LOST DECADE’ SCENARIO
There is also a lot of uncertainty on the horizon. Instead of having a renaissance we could be heading into a lost decade of low economic growth, high inflation, rising interest rates, and stock market losses. Unfortunately, longer periods of malaise are not unprecedented, particularly from periods of extreme stock market valuation, like today. Proposed policies that could be problematic include:
- Imposing tariffs of 10% globally and up to 60% on goods imported from China.
- Deportation of up to 20 million undocumented immigrants.
- Reducing government spending (which could be good or bad).
TARIFFS: CONSUMERS PAYING HIGHER PRICES FOR GOODS
Tariffs are the biggest unknown. They were an important policy tool before the Great Depression in the 1930s. The chart below, which examines historical tariff rates, shows that rates were far higher before 1930 than they are today.
The infamous Smoot-Hawley Tariff Act exacerbated the Great Depression and transformed what might have been a bad recession into a severe, multi-year depression. That is why so many economists are concerned about reinstating a policy tool that could be damaging.
Trump is arguing that tariffs will bring manufacturing back to the U.S. Maybe, but there is evidence that won’t happen, at least on the scale he has discussed. On the other hand, tariffs willcertainly raise prices.
It may also be that tariffs are at least partially responsible for the concentrated business cycles that existedbefore 1930. The gray bars on the Historical Tariff Rates chart represent recessions, and there were a lotmore of them before tariffs diminished. Since then, recessions have become less frequent, shorter, and milder, on average, making it easier to weather the storms when they do come. A renewed dependence on tariffs risks taking us back to the prior economic regime.
IMMIGRATION AND LABOR
The new administration’s immigration plan could lead to the deportation of millions of undocumented people if fully implemented. Undocumented immigrants make up 20% of the U.S. labor force and generate a sizeable, positive economic impact. They pay taxes and contribute toSocial Security and Medicare.
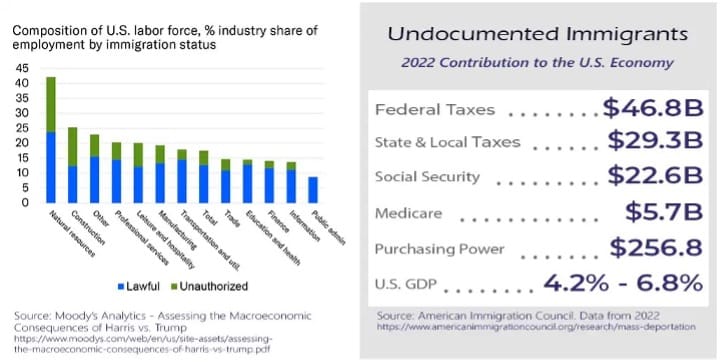
Also, the money they earn results in a lot of purchasing power. In fact, it’s estimated to be 4% to 7% of GDP. So, if these people go away, it will erase all our annual economic growth. The bar chartabove, depicting the U.S. labor force composition by immigration status, highlights the potential impact on sectors such as natural resources and construction.
SPENDING CUTS
Cuts to government spending are needed and overdue. The government’s deficit is out of control, and debt-to-GDP is well above sustainable levels. The total annual budget has gone from$118 million in 1965 to $7 trillion in 2024.
The Trump administration, through his DOGE representatives, is talking about cutting $2 trillion from the budget, but it will be tough to identify those savings. 60% of the budget is “mandatory” items like Social Security, Medicare, and Medicaid. 13% is interest on debt that must be paid.
That leaves “only” about $2 trillion that could be cut between discretionary items and defense. However, it seems unlikely Trump would advocate to significantly reduce the defense budget. So, the math doesn’t seem to add up on spending cuts.
The other problem is that even if spending cuts could be identified, it would be highly recessionary to reduce government spending by $2 trillion. Measured against total nominal GDP of $29.3 trillion, $2 trillion comes to 6.8%, which would effectively wipe out nominal GDP, just like deporting all the undocumented immigrants. It is possible that some can be made up by thecorporate and consumer sectors, but probably not without a lag and some turmoil that could result in adoozy of a recession.
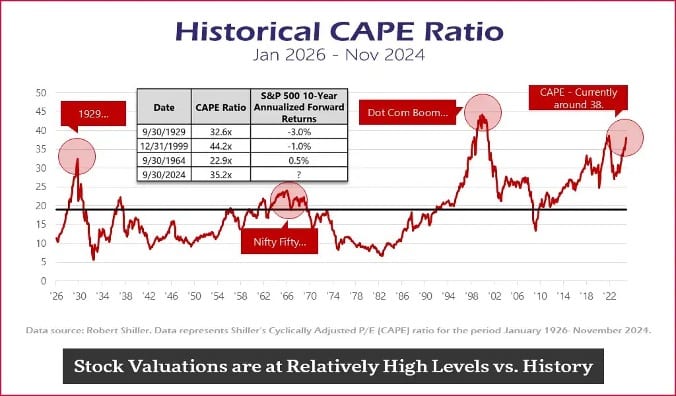
THE CURRENT ENVIRONMENT: STOCK VALUATIONS
What does all this mean? Against today’s backdrop with the stock market trading at all-time highs, we’re facing a risky environment ahead.
The graph on the next page shows the historical CAPE ratio, a metric developed by Nobel RobertShiller. It is like the price/earnings ratio but takes today’s stock market price and divides it by the average earnings over the last ten years. The valuation of the overall stock market is the second highest it has ever been, second only to the Dot-Com bubble in the late 1990s. Valuations are even higher than they were just before the Great Depression.
Historically, valuation peaks have preceded periods of flat to down years for stocks. And lost decades have not been unusual. But it’s also not a guarantee that this will recur. CAPE ratios have been above average since the 90s and stock returns have generally fared well.
That said, high valuations do make high future returns more difficult, as incremental gains will be reliant on a continuation of strong earnings growth rather than significant further valuation multiple expansion.
PROJECTED ECONOMIC IMPACT
So, which is it? Are we in a renaissance or a lost decade? The best basis we have for the economic impact of the new administration is probably from forecasts provided by the Penn Wharton Budget Model, Tax Foundation, and the Committee for a Responsible Federal Budget.
They forecast about a half percent drop in GDP from Trump’s policies. Wages could go up minimally, and the deficit could increase by $2 trillion dollars over the next 10 years. Far fromsolving the debt problem, the experts predict Trump will make it worse. If true, the implications could be significant. There was a study done by economists Reinhart and Rogoff, who looked at the relationship between public debt and economic growth. What they found was that when debt-to-GDP gets above about 90%, there’s a slowdown in future economic growth. That would mean Trump’sproposed policies are detrimental and we’re heading toward the lost decade scenario. But wait.
Bear in mind that the experts are frequently wrong. University of Pennsylvania Professor Philip Tetlock has made a career of studying “the experts,” and hasn’t found them to be very expert. He hasnoted in his research that the experts don’t seem to have any more insight than anyone else, and in fact,their hubris can often jeopardize their objectivity, resulting in forecasts that are just dead wrong. Another study found that the experts were right 47% of the time, which is worse than a coin flip.
It may also be that we have gridlock, even with the Republicans at the top of the executive branch and in control of both houses of Congress. Not all Republicans are Trump supporters and obstruction would not be surprising.
Unfortunately, all of this doesn’t give us much direction for the year ahead, other than volatility in one direction or the other is likely. There are fancy option strategies one could implement to take advantage of this type of volatility, but most likely the best bet is to diversify and focus on the long term.
After all, cycles come and go, and it is best to separate your politics from your portfolio.
As always, reach out to us if you have questions about your portfolio, the current market environment or our investment management process.
www.rdgcapitalmanagement.com
aryan@rdgcm.com
585.673.2683